If you’re like me, you’ve probably noticed how fast altcoins move compared to Bitcoin. One day a coin is sitting quietly in the background, and the next it’s up 200%, leaving everyone wondering if they missed the boat. That’s the thing about altcoins: they’re exciting, unpredictable, and often way more volatile than Bitcoin.
But here’s the catch. If you don’t know how to track their performance, you’re basically flying blind. Altcoins aren’t just random lottery tickets, they can be measured, compared, and understood if you know what to look for.
The good news? You don’t need to be a pro trader with ten monitors and a Bloomberg Terminal to stay on top of things. With the right metrics and free tools, anyone can track altcoins like a pro. Let me show you exactly how I do it.
Why Tracking Altcoins Matters
Bitcoin is still the gold standard. It sets the tone for the market and acts as a kind of reserve currency in crypto. But the truth is, altcoins often move faster. They have smaller market caps, which means they can double or triple in value much quicker than Bitcoin.
Take 2025 as an example. Bitcoin has gained roughly 18% year-to-date, which is solid. But in the same period, XRP has exploded more than 300%, TRON is up 117%, and Solana has rallied 145%. If you were only looking at Bitcoin, you’d have completely missed those opportunities.
This is why tracking matters. Altcoins can give you an edge, but you need to know what’s driving their performance. Are they gaining adoption? Is there a spike in trading volume? Or is it just speculative hype that could fade overnight? The metrics tell the story, and once you know what to track, the whole market starts to make a lot more sense.
The Key Metrics I Track

When I look at altcoins, I don’t just stare at the price chart. Price alone doesn’t tell the whole story. Instead, I look at a handful of metrics that together give me a clearer picture of what’s really happening. Here are the ones I always check:
1. Market Capitalization
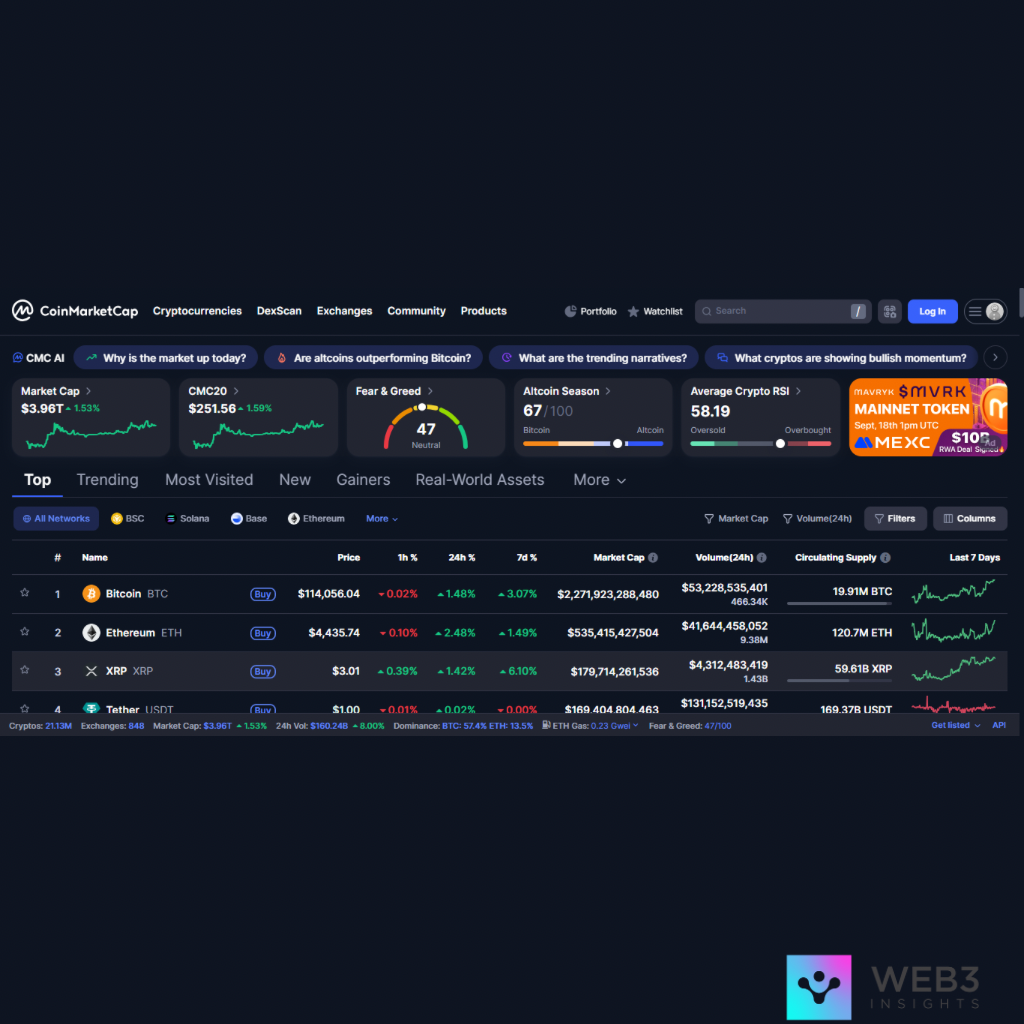
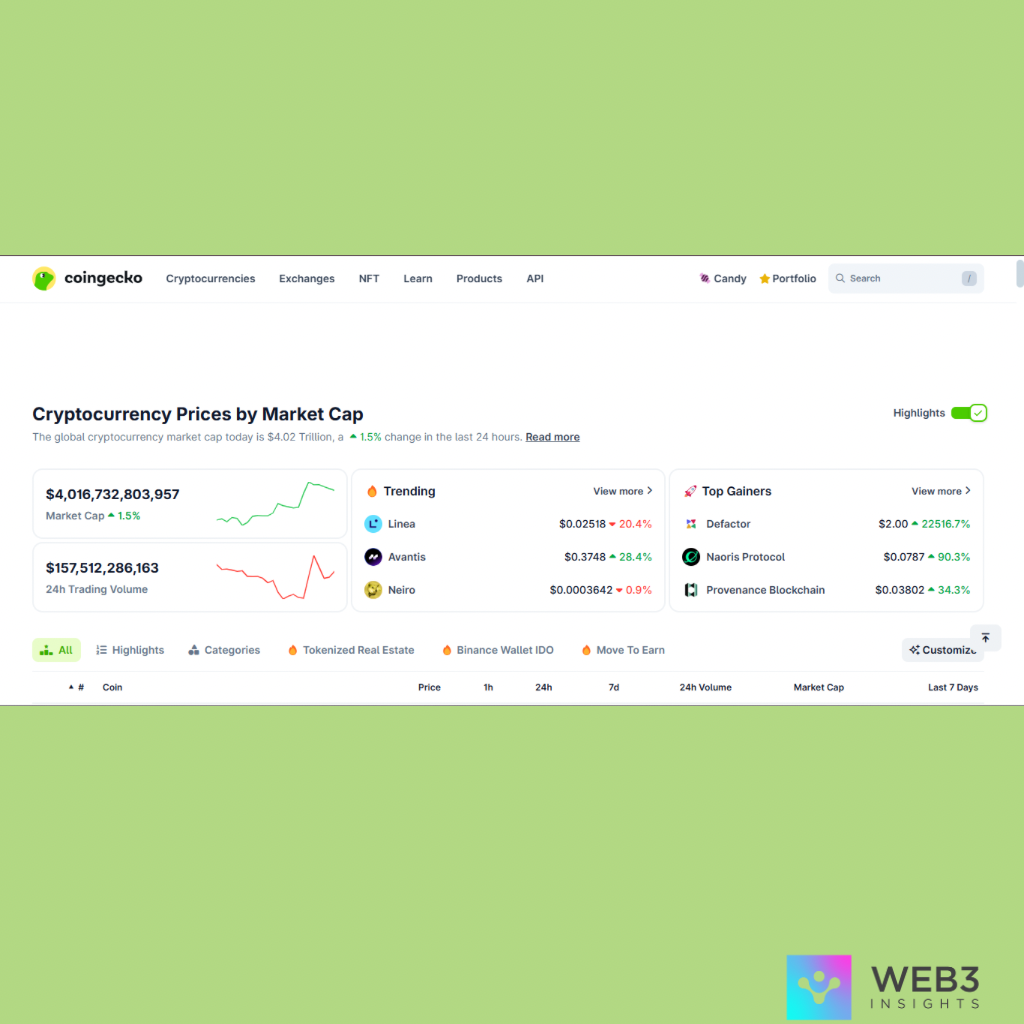
Market cap is simply the total value of a coin (price × circulating supply). It tells me how “big” a project is compared to others. For example, a coin with a $500 million market cap is still considered small-cap, meaning it has room to grow (but also carries more risk).
I usually check this on CoinGecko or CoinMarketCap. They have live rankings that make it super easy to compare coins side by side.
2. Trading Volume
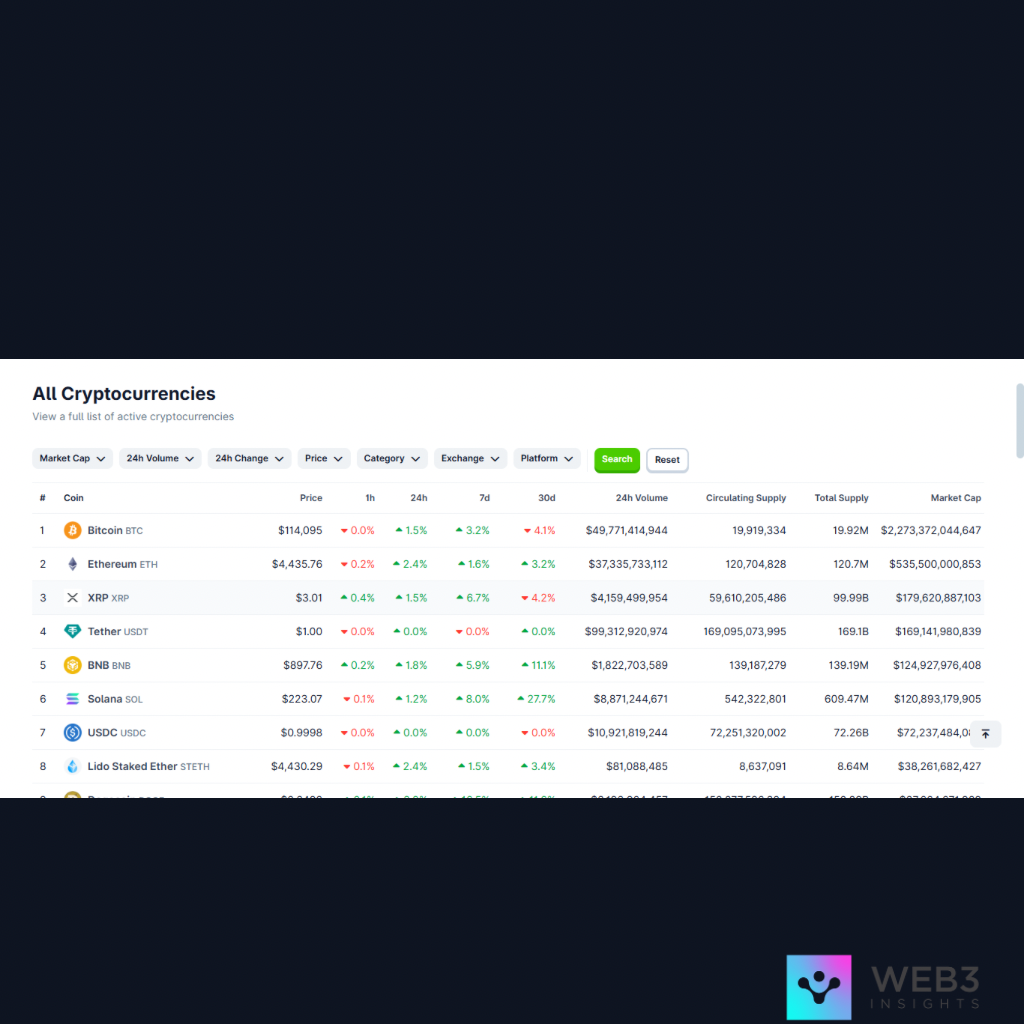
If the market cap is the size of a coin, trading volume is the heartbeat. Volume shows me how much money is flowing in and out of a coin over 24 hours.
Spikes in trading volume usually signal that something big is happening, either a pump driven by news or a real wave of adoption. If I see volume rising steadily over weeks, that’s usually a bullish sign. I grab this data straight from CoinGecko since it’s listed right next to price.
3. Price Performance (YTD or ROI)
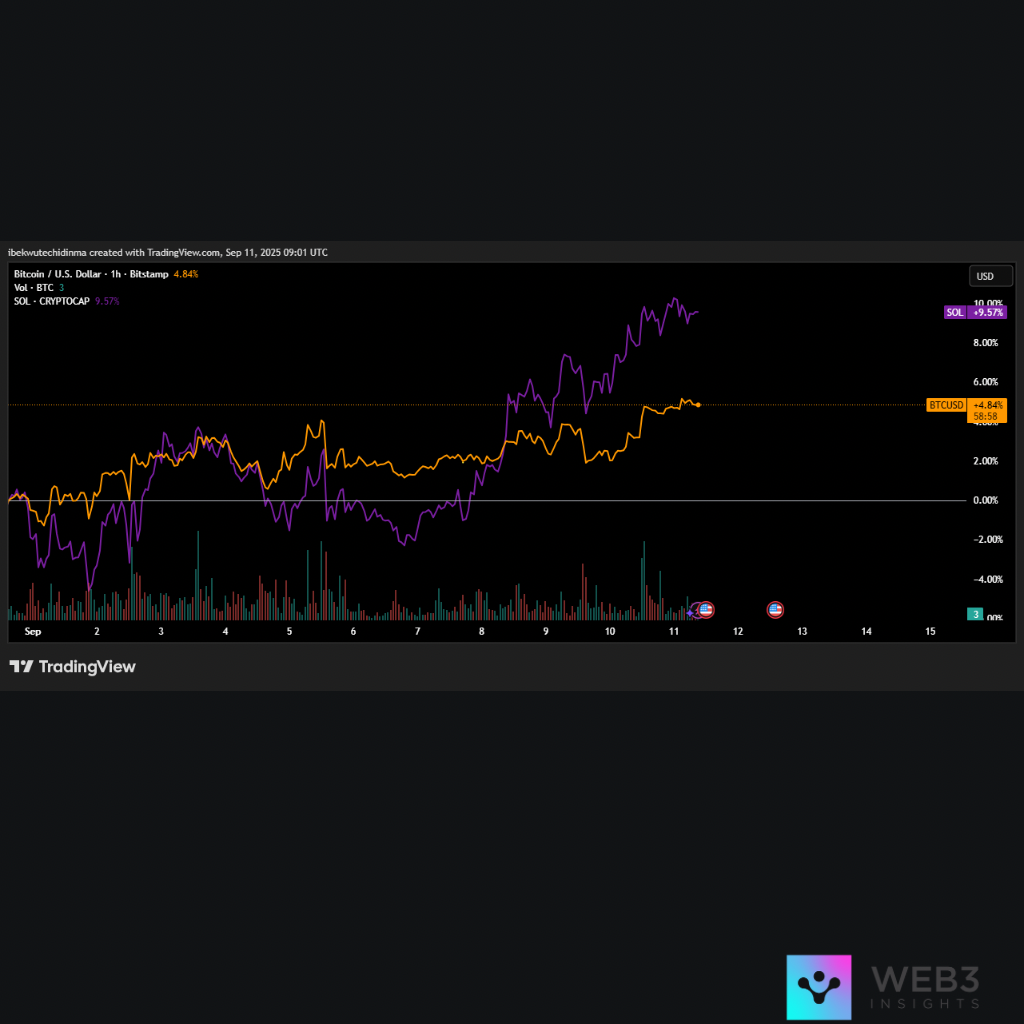
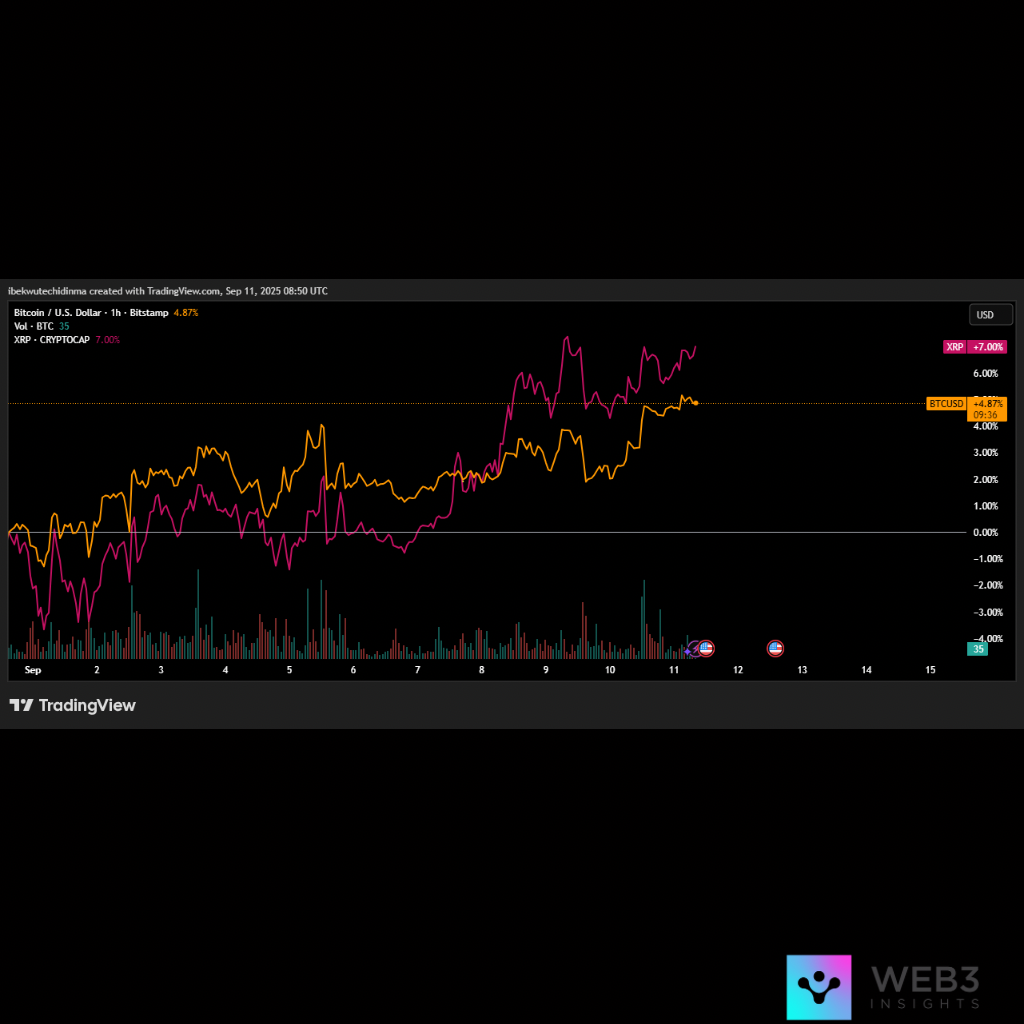
Price is still important, but I prefer to look at it in terms of percentage performance. For instance, in 2025, Bitcoin is up around 18% year-to-date. Compare that to Hyperliquid, which has jumped over 82% YTD, or XRP’s massive 300% surge earlier this year.
To make these comparisons, I use TradingView. I’ll load Bitcoin’s chart, then overlay XRP or TRON on it to see how they move against each other. This way, I can tell immediately whether an altcoin is outperforming Bitcoin.
4. DeFi Metrics (TVL & Stablecoin Flows)
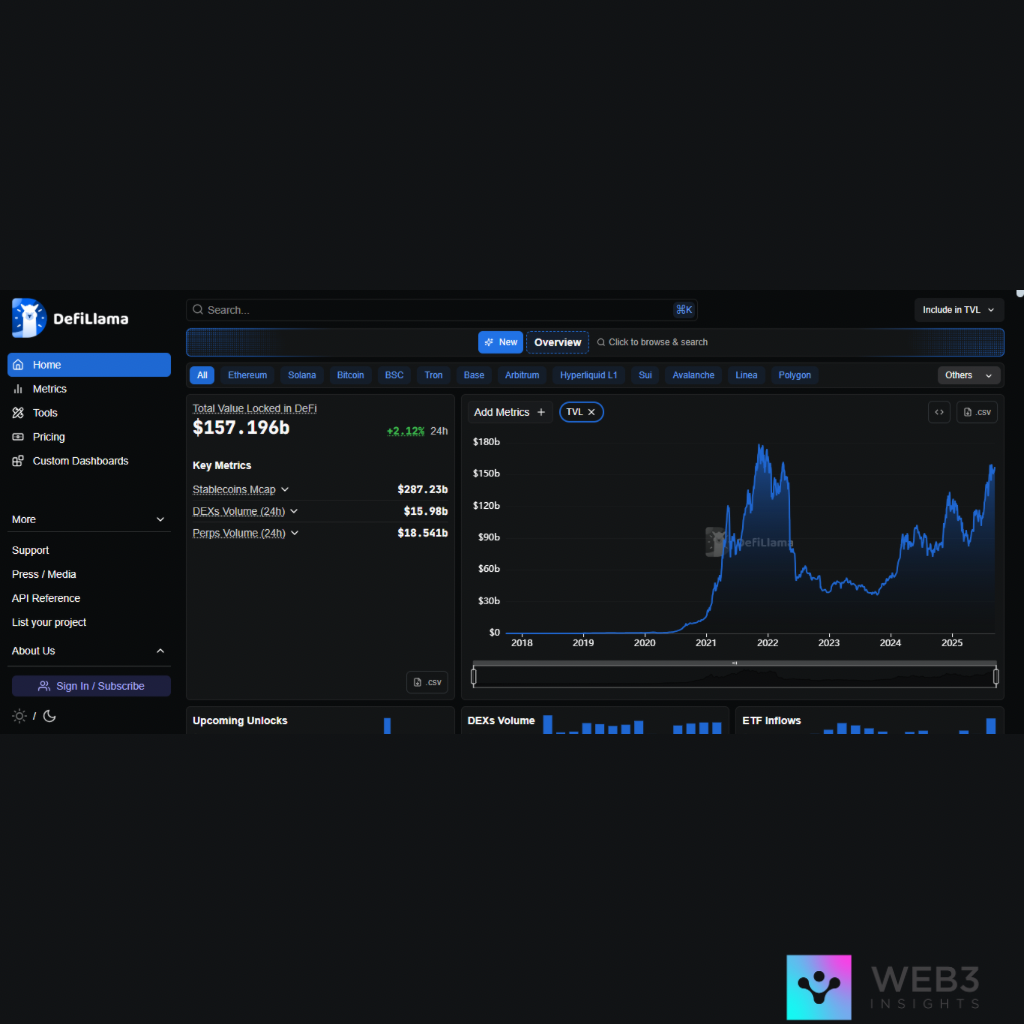
For coins tied to DeFi (like TRON or Solana), I always check TVL; Total Value Locked. TVL measures how much money is sitting inside a blockchain’s DeFi ecosystem. The higher the TVL, the more trust users are placing in that network.
For this, DefiLlama is my go-to. It shows which chains are pulling in liquidity and which ones are losing it. TRON, for example, dominates stablecoin transactions, which explains a lot of its strength in 2025.
5. On-Chain Activity
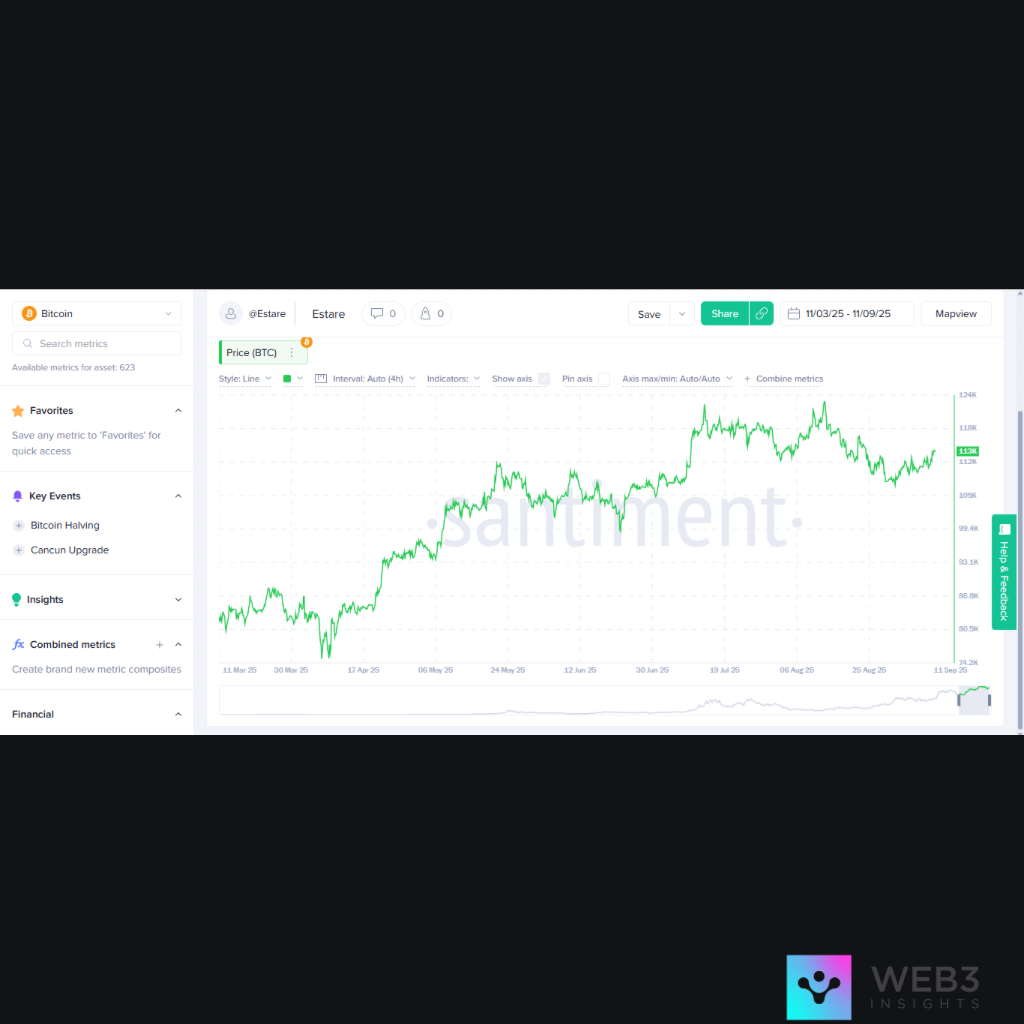
Another big one is on-chain activity. This includes the number of active wallets, transaction counts, and overall network usage. A coin can pump in price for a few days, but if no one is actually using it, the hype won’t last.
Here I sometimes check Santiment (they give some free metrics) or Glassnode (better for Bitcoin and Ethereum, but useful for comparison). For Solana, I also like looking at Solana Compass, which shows daily active users.
Final Thoughts
Tracking altcoins doesn’t have to be complicated. With the right metrics and a few free tools, you can separate hype from reality and spot trends before the crowd.
For me, the key is consistency. The more you track, the better your instincts become. Over time, you’ll start noticing patterns, like how trading volume often spikes just before a big move, or how TVL growth usually hints at a sustainable rally.
So if you’ve been relying only on Bitcoin’s chart, now’s the time to widen your view. Start with just one or two tools, check them daily, and build your way up. Before long, you’ll find yourself reading the altcoin market like a book.


